Heavy metal contamination can be an issue in gardens and agricultural facilities, especially ones in urban areas. If present in the soil, these metals can enter plant tissues, and can lead to ingestion when the plants are eaten. This is the most common exposure to heavy metals. Certain metals such as Arsenic (As), Mercury (Hg), and Lead (Pb) can cause adverse health effects when ingested. These adverse health effects can include cancer and failure of multiple organs. Other metals, like Manganese (Mn), Copper (Cu), and Zinc (Zn) are important micronutrients but can be dangerous in high quantities.
To avoid exposure to hazardous metals, it is important to screen gardening material before growing plants with them. However, certain plant species have the ability to uptake high quantities of metals even when those metals are not found in high concentrations in the growth medium. This is where we come in. With funding from the University of Arizona Campus Sustainability Fund and the Center for Environmentally Sustainable Mining, we screened plants from two University of Arizona facilites for metals to determine if the campus community is being exposed to hazardous metals and identify plant species that may uptake more metals than normal.
Sampling Locations
Methodology

This project followed a pipeline that our lab initially developed to survey metal contaminated sites and identify plants that uptake metals. While our sampling locations are not contaminated with metals, the main steps stay the same.
The first step was to collect plant samples from our sampling locations. At the University of Arizona Community Garden, we collected plant samples from multiple plots most of which were maintained by the garden staff or Compost Cats. We were also given permission to take plant samples from a number of private plots in the community garden. At each plot we collected samples from up to three individuals of each species present. At the Biosphere 2 Freight Farm, we collected up to 5 samples of each species present to ensure that we obtained enough material for reliable analysis.
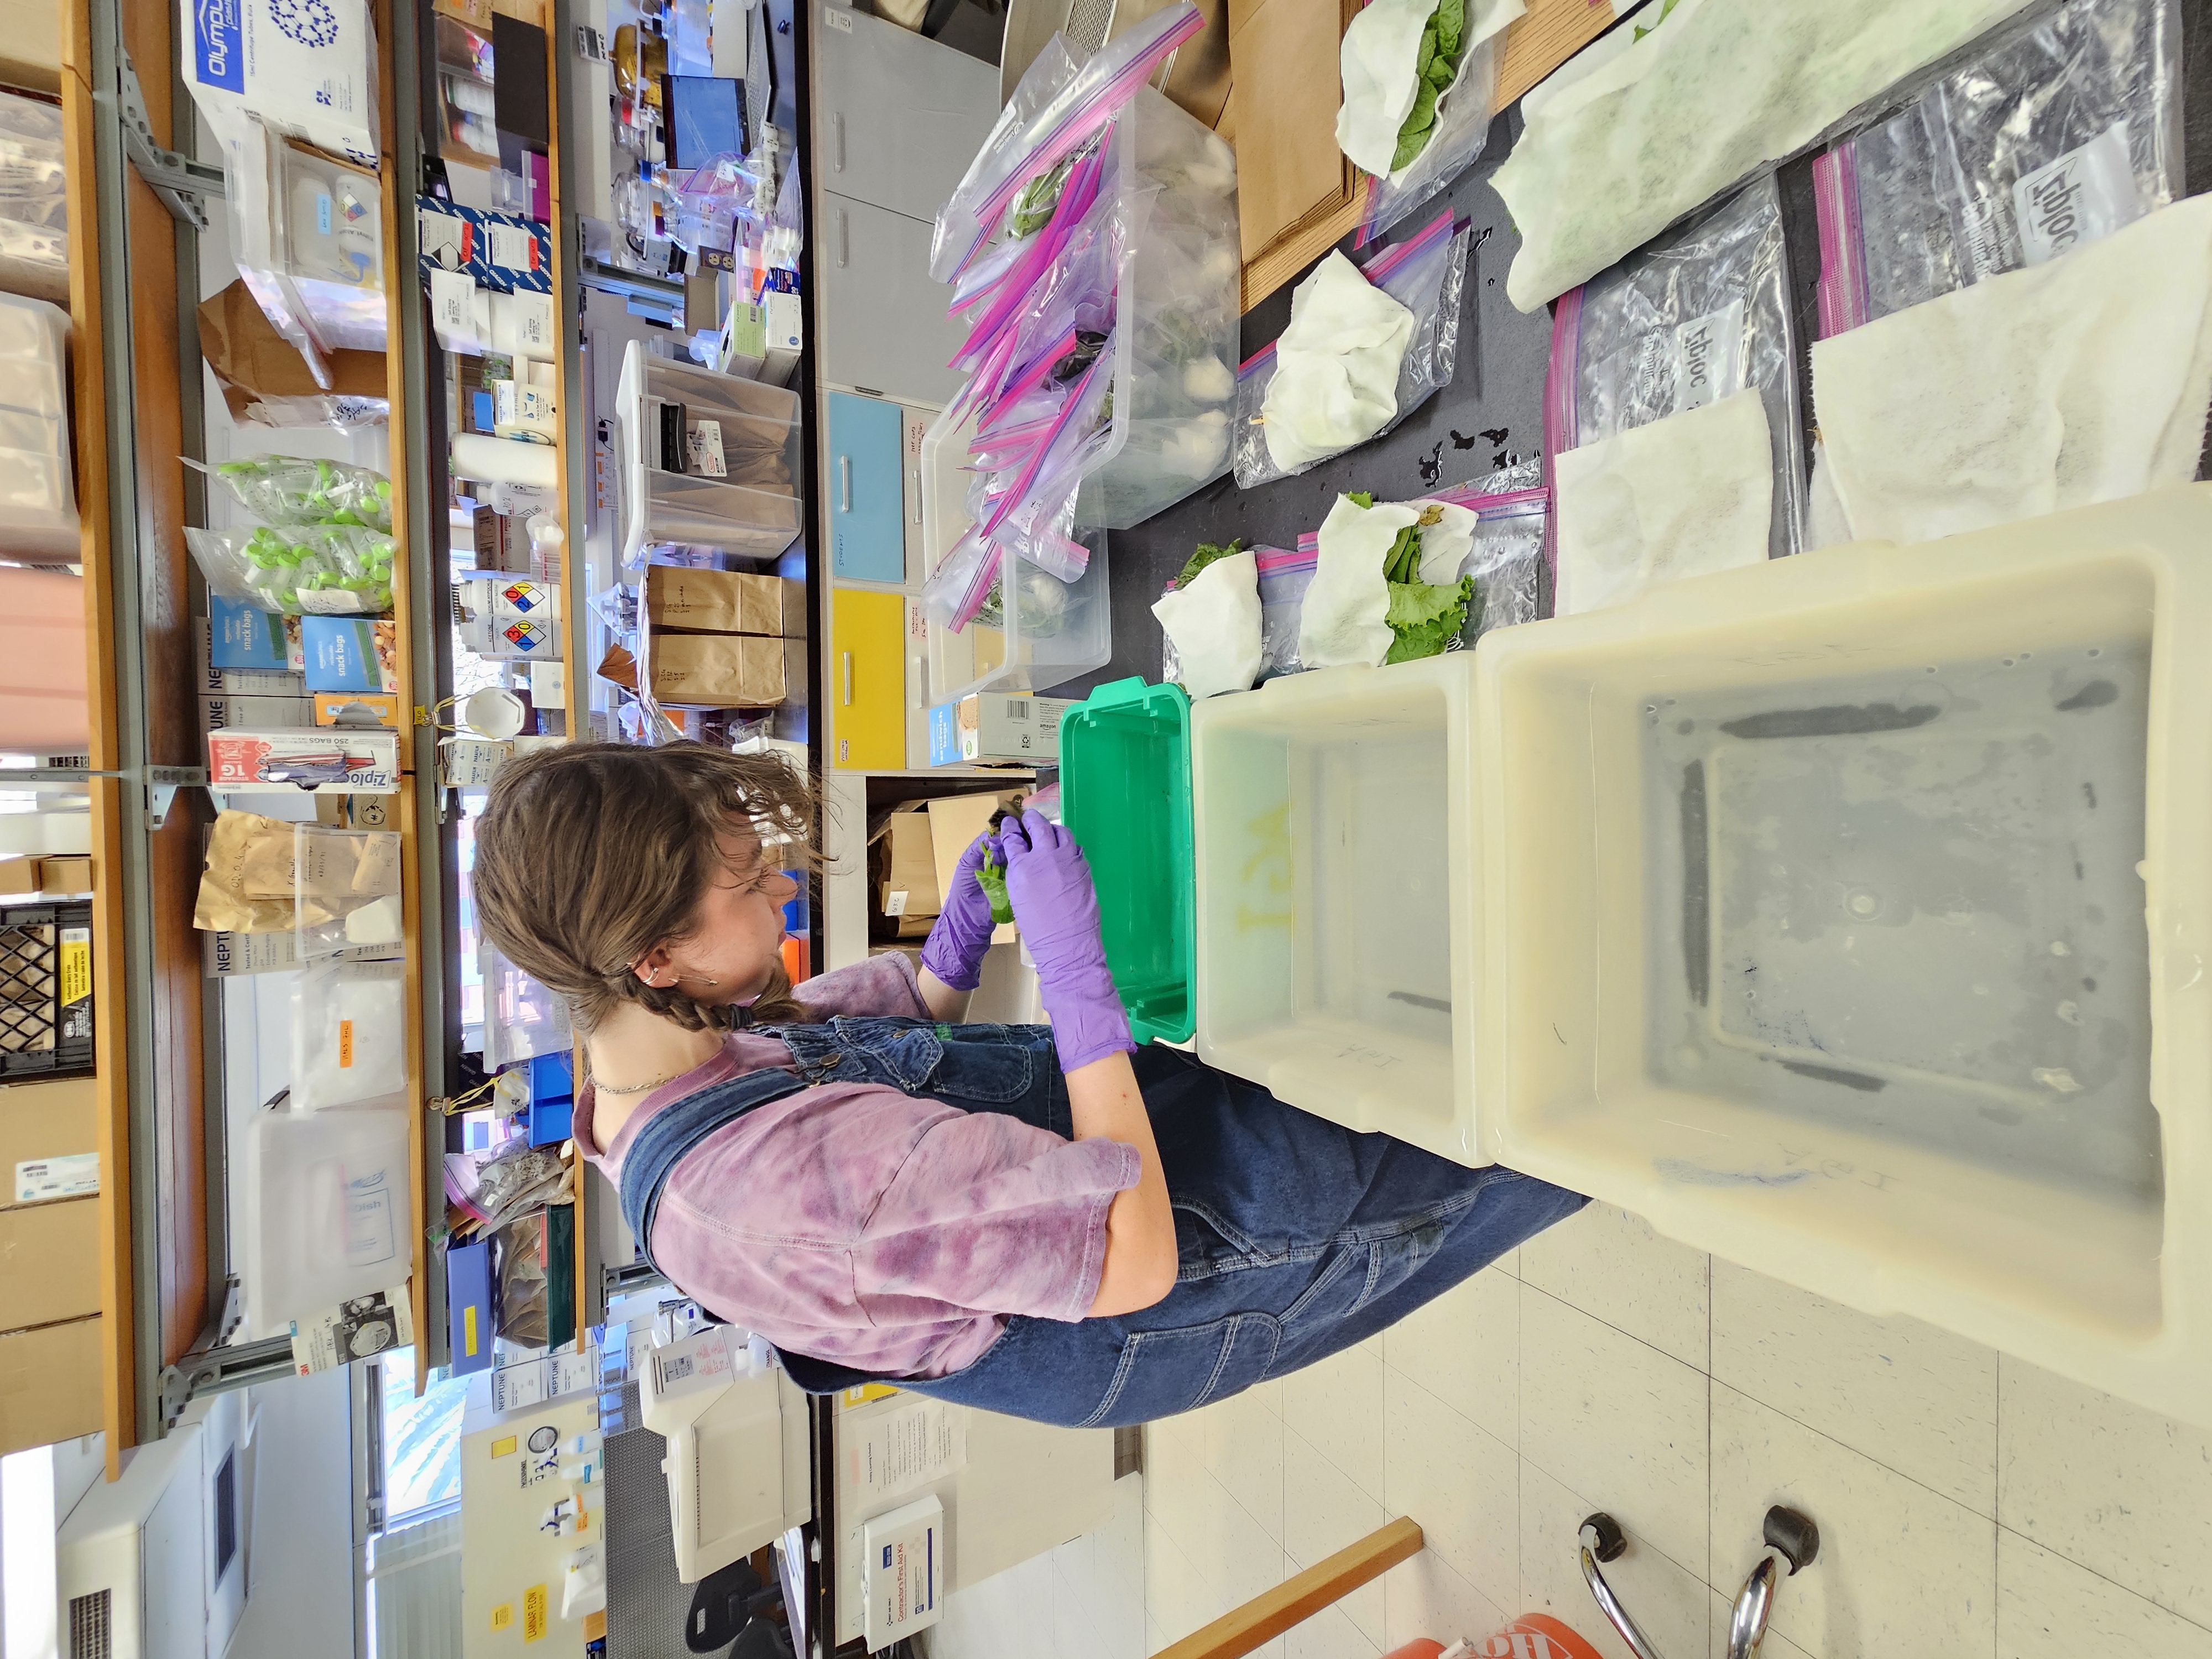
Once our plant samples are in the lab, the next step is to throughly wash each sample. To do this we cleaned each sample in three separate water baths and used brushes to remove any remaining dirt. After drying we separated each plant's roots, stems, leaves, and flowers/buds. This is primarily because plants can control where they move certain elements in their tissue, for this project we were most interested in the leaves. We then dried the plant tissue for three days to ensure that all water had evaporated. Finally we ground each sample into a fine powder, both by hand and mechanically.
After grinding, we scanned our samples with a portable Xray Fluorescence (pXRF) Analyzer. This device uses an Xray beam that causes the atoms in our sample to emit a specific energy. Each element sends out it's own energy signature that the pXRF reads and converts into a number.
Data and Findings
Below are two tables with some of the most important data that we gathered. We chose to focus on Chromium, Manganese, Copper, Zinc, Arsenic, Cadmium, Mercury, and Lead in these tables due to their potential toxicity. If you are interested in seeing all of the elements that we measured, a full spreadsheet is available here.
Before diving into our data, there are a few things to note. First, our measurements are in parts per million (ppm). This unit is the same as milligrams per kilogram (mg/kg). Second, each element has two numbers associated with it, a concentration and an uncertainty. The concentration is the actual measurement and the uncertainty a quantification of the potential error in our measurement. If you want to find the possible maximum and minimum value of a measurement, add and subtract the uncertainty from the concentration. For example, for a concentration of 10 ppm with an uncertainty of ± 2, the actual value could range from 8 ppm to 12 ppm. Third, each measurement is color coded based on how hazardous they are. Green means completely safe. Yellow indicates that their may be some cause for concern. Red indicates a measurement that is likely hazardous.
We are happy to report that none of the plants that we measured had hazardous metal concentrations!
Acknowledgements
This project would not have been possible without the help of many people from multiple units across the University of Arizona campus. First and foremost, thank you to our undergraduate team, Averi and Maddie, for all of the work that they put into collecting and processing our samples. Thank you to Nat Schwark and the rest of the team at the UA Community Garden for giving us access to their plants and for helping us to identify the samples that we collected. We would also like to thank Jason Deleeuw and the rest of his team at the Biosphere 2 Freight Farm. Finally We would like to thank the Office of Sustainability and the Campus Sustainability Fund, specifically Emily Haworth and Prarthanaa Singhal, for sticking with us through this project's ups and downs.

